First, what is DAX and why is it needed? DAX is a formula-based query language. In Power BI, data is sourced from applications, files or analytics data sources. The data sourced might not have all the columns and metrics required for reporting. DAX is used for creating these custom columns and metrics. DAX is also used to create intermediate tables required for handing complex relationships lookup tables and other use cases.
Learning DAX can be challenging at the start as it is not a procedural language like C, Java or .Net. Before you start on the DAX journey you should be aware of some fundamentals.
- Function (Language Fundamentals)
- Data Model
- DAX Calculation Type
- Calculated Table
- Calculated Column
- Measure
- Row Context
- Filter Context
Language Fundamentals
- DAX (Data Analysis Expressions) is a formula-based language
- A typical DAX formula is assembled by using DAX functions. It is necessary to understand the different parts of a function. This approach will save you significant time as you proceed further in your DAX journey.
- Functions are used to write DAX formulas to create Calculated Columns, Measures and Derived Tables
- Functions use model objects (Tables, Calculated Tables, Columns, Calculated Columns and Measures) as input parameters for calculations
- Functions can be nested
- Functions return output either a Boolean value or a Scalar value or a Table
- Different functions behave differently. Some return all rows, some distinct rows and some ignore blank values
- For writing DAX formulas, you also use Variables, Constants and Operators
- DAX variables are used to store intermediate values or dataset
The example code below shows how a DAX formula is assembled.
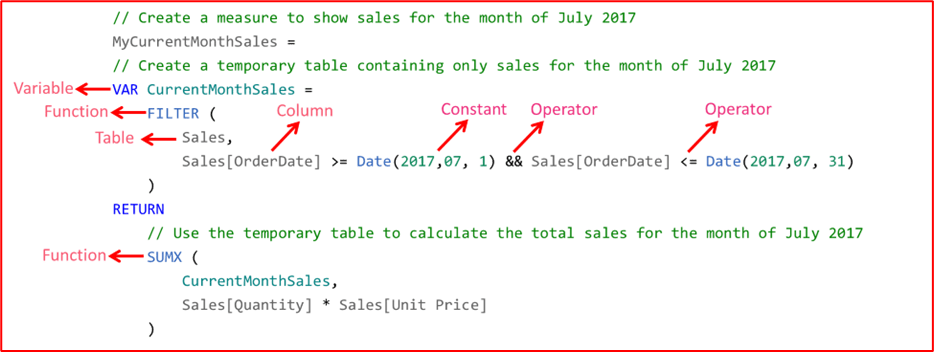
Figure-1: Sample DAX code
Modelling Fundamentals
- In Power BI Data is viewed in a Tabular format
- When datasets from a data source are selected and loaded into Power BI, a Data Model is created. By default, each dataset is converted into a Table, and Relationships are created between the tables. Relationships must be defined between these Tables if not fetched from the connected data source. (Though relations can be defined at run time, it is used in special circumstances).
- The relationships between the tables can be One-to-Many or Many-to-Many. DAX functions make use of these relationships to fetch related data in the joined tables.
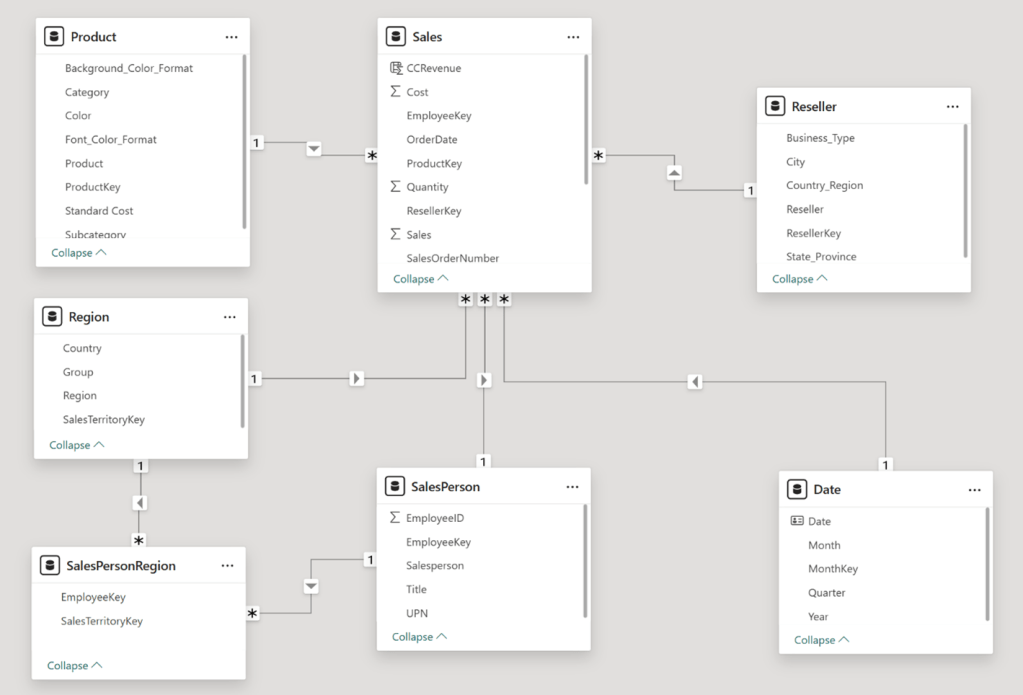
Figure-2: Sample Data Model
Calculated Column
- As the name suggests Calculated Column is a derived column and is created using the existing columns
- Calculated Column returns a scalar value
- Calculated column can reference other tables in the Data Model only by using RELATED function
- Calculated Column is populated at design time or when the model is opened or refreshed
Measure
- A Measure is like a parametrised formula.
- Measure returns a scalar value
- It is a part of the Data Model and not a part any Table, though for the purpose of understanding it is created under a table.
- The formula of measure can reference any table in the Data Model.
- A measure is populated at query time and its value depends on the current set of filters used in the Data Model
- If you are coming with a SQL background, think of this as an aggregate expression. The only difference is that in DAX, the group-by columns are fetched at runtime.
Calculated Table
It is a derived table created using DAX. Calculated tables are visible in Data view of Power BI but not in Power Query
- Returns a table
- Populated at design time or when themodel is opened or refreshed
- Calculated tables can be useful in various scenarios
- Date Tables
- Role-Playing Dimensions
- What-if Analysis
Context
- DAX functions make use of two contexts for accessing table values, Row Context and Filter context
- Context is a logical construct which defines the dataset available to the DAX formula
- DAX functions that do not do row-by-row processing do not have access to a row context. Any expression requiring row by row processing in such functions will throw an error.
- When you are writing a DAX formula, you must keep in mind how Row and Filter contexts are being used. Answers to the following questions should be ascertained.
- Which context does the function create, Row Context or Filter Context or both?
- Does the function combine its own filter with the existing filter?
- Does the function override existing filters?
- Does the function ignore existing filters?
Row Context
- Is the current row of the Table used in the DAX formula
- If you are coming with a SQL background, think of it like a cursor
- A row context is created by any DAX function that requires row by row processing and needs access to column values in each row of a table. One such example is SUMX.
- Row context is also created when a Calculated column is created
- Some DAX functions require a Row context to work (Ex. RELATED, EARLIER, SUMX and other iterator Functions)
Filter Context
- Is a filtered resultset. The resultset can be one row of a table(s), more than one rows or the entire model itself. The most important word to understand here is “resultset”. So a Filter Context is a logical name given to a resultset attained from a Data Model after applying a Filter. Note that when no filter is applied, the Filter Context is the entire Data Model. In this case, you can think that the Filter is empty.
- A Filter Context does not provide access to a column value in each row. It works on a set of values.
- It does allow you to summarize a column (set of values)
- If you are coming with a SQL background, think of it like a filtered resultset with a WHERE clause(s)
- A Filter Context is created when we create a Measure or when we call functions that create a Filter Context
- Filter Context is alerted by any filter action
- Filters are applied at report design time in the Filters pane
- Filters are applied using slicer visual
- Filters are also applied using Report visuals, which perform grouping
- Filters can be added when a report user interacts with the report. They can modify filter settings in the Filters pane, and they can cross-filter or cross-highlight visuals by selecting visual elements like columns, bars, or pie chart segments
- Some functions override the inherited Filter context with the filter defined within the function
- Some functions ignore all the inherited filters
- When Row Context is used in a measure, it is converted into a Filter Context
The simplest way to understand the difference between Row Context and Filter Context is by using two DAX functions SUM and SUMX.
SUM only has access to filter context whereas SUMX has access to both Filter and Row Context.
Let’s take a Sales table with the following columns.
OrderNumber, ProductKey, UnitPrice, Quantity, SaleAmount, Cost
To calculate revenue as a Measure, any of the following three DAX formula can be used.
- Revenue = SUM (Sales [SaleAmount])
- Revenue = SUMX (Sales, Sales [SaleAmount])
- Revenue = SUMX (Sales, Sales [Quantity]* Sales [UnitPrice])
SUM (Sales [SaleAmount]) works on a Filter Context. The Filter context here is a one-column table containing all values in the SaleAmount. There is no Row Context here. If you try to refer to more than one column in SUM it will throw an error as it does not have access to the Row Context.
SUMX (Sales [SaleAmount]) works on both Filter and Row Context. The Filter context here is the full Sales Table and the Row Context is the current row in the Sales Table. SUMX iterates through all the rows of Sales Table (Filter Context) and sums up the values of SaleAmount.
SUMX (Sales, Sales [Quantity]* Sales [UnitPrice]) works on both Filter and Row Context. The need for a Row Context is more evident and makes more sense here. The expression Sales [Quantity]* Sales [UnitPrice] refers to two columns in the same row which is possible only with a Row Context.
Like any other language mastering DAX will take some time. It will come with more and more practice. But the crux is to keep the fundamentals explained above in mind all the time. Revisit the fundamentals and keep connecting the dots as you move along the DAX journey!!
